

Madden-Julian Oscillation precipitation Hovmöller diagnostic#
Overview#
This recipe computes lag-regression Hovmöller diagrams of the Madden-Julian Oscillation (MJO). For each dataset, daily tropical precipitation is averaged over a latitude band and its day-of-year climatology is removed. The resulting anomalies are Lanczos band-pass filtered to the 20-100 day MJO period range. A reference index is built by averaging the filtered field over a reference longitude sector, and the full filtered field is then regressed against this index at a range of lags.
The result is a longitude-lag diagram: an eastward-propagating diagonal band is the signature of MJO convection.
Available recipes and diagnostics#
Recipes are stored in recipes/
recipe_mjo_hovmoeller.yml
Diagnostics are stored in diag_scripts/mjo/
mjo_hovmoeller.py: compute the lag regression and plot the Hovmöller diagram.
User settings in recipe#
Script mjo_hovmoeller.py
Required settings for script
reference_longitudes: longitude sector[lon0, lon1](in degrees East) used to build the MJO reference index that the filtered field is regressed against.low_period: lower period cutoff (in days) of the Lanczos band-pass filter.high_period: upper period cutoff (in days) of the Lanczos band-pass filter.lanczos_weights: number of weights of the Lanczos band-pass filter. Must be an odd integer greater than 1.max_lag: maximum lag (in days, in both directions) computed by the lag regression.
Optional settings for script
longitude_limits: longitude axis limits of the Hovmöller plot (default:[0.0, 360.0]).contour_levels: number of contour levels in the Hovmöller plot. Must be at least 3 (default:21).colormap: matplotlib colormap used for the Hovmöller contour plot (default:RdYlBu).plot_title: title of the Hovmöller plot (default:MJO Hovmöller diagram).colorbar_label: label for the figure’s colorbar (default:Precipitation regression coefficient).
Required settings for variables
none beyond the standard
short_name,mip,preprocessorandtimerange.
Optional settings for variables
none
Required settings for preprocessor
extract_region: restrict the data to the tropical latitude band used for the diagnostic.regrid: regrid all datasets onto a common regular grid.meridional_statistics: average over the extracted latitude band (operator: mean).daily_statistics: reduce the data to daily means (operator: mean).anomalies: remove the day-of-year climatology (period: day).convert_units: convert precipitation tokg m-2 day-1.
Optional settings for preprocessor
none
Color tables
none
Variables#
pr (atmos, daily mean, longitude latitude time)
Observations and reformat scripts#
Note: ERA5 is read directly through ESMValCore’s native6 support; no separate reformat script needs to be run beforehand.
ERA5 (native6 project, tier 3,
frequency: 1hr)
References#
Hannah, W. M., Jones, C. R., Hillman, B. R., Norman, M. R., Bader, D. C., Taylor, M. A., et al. (2020). Initial results from the super-parameterized E3SM. Journal of Advances in Modeling Earth Systems. 12, e2019MS001863. https://doi.org/10.1029/2019MS001863
Example plots#
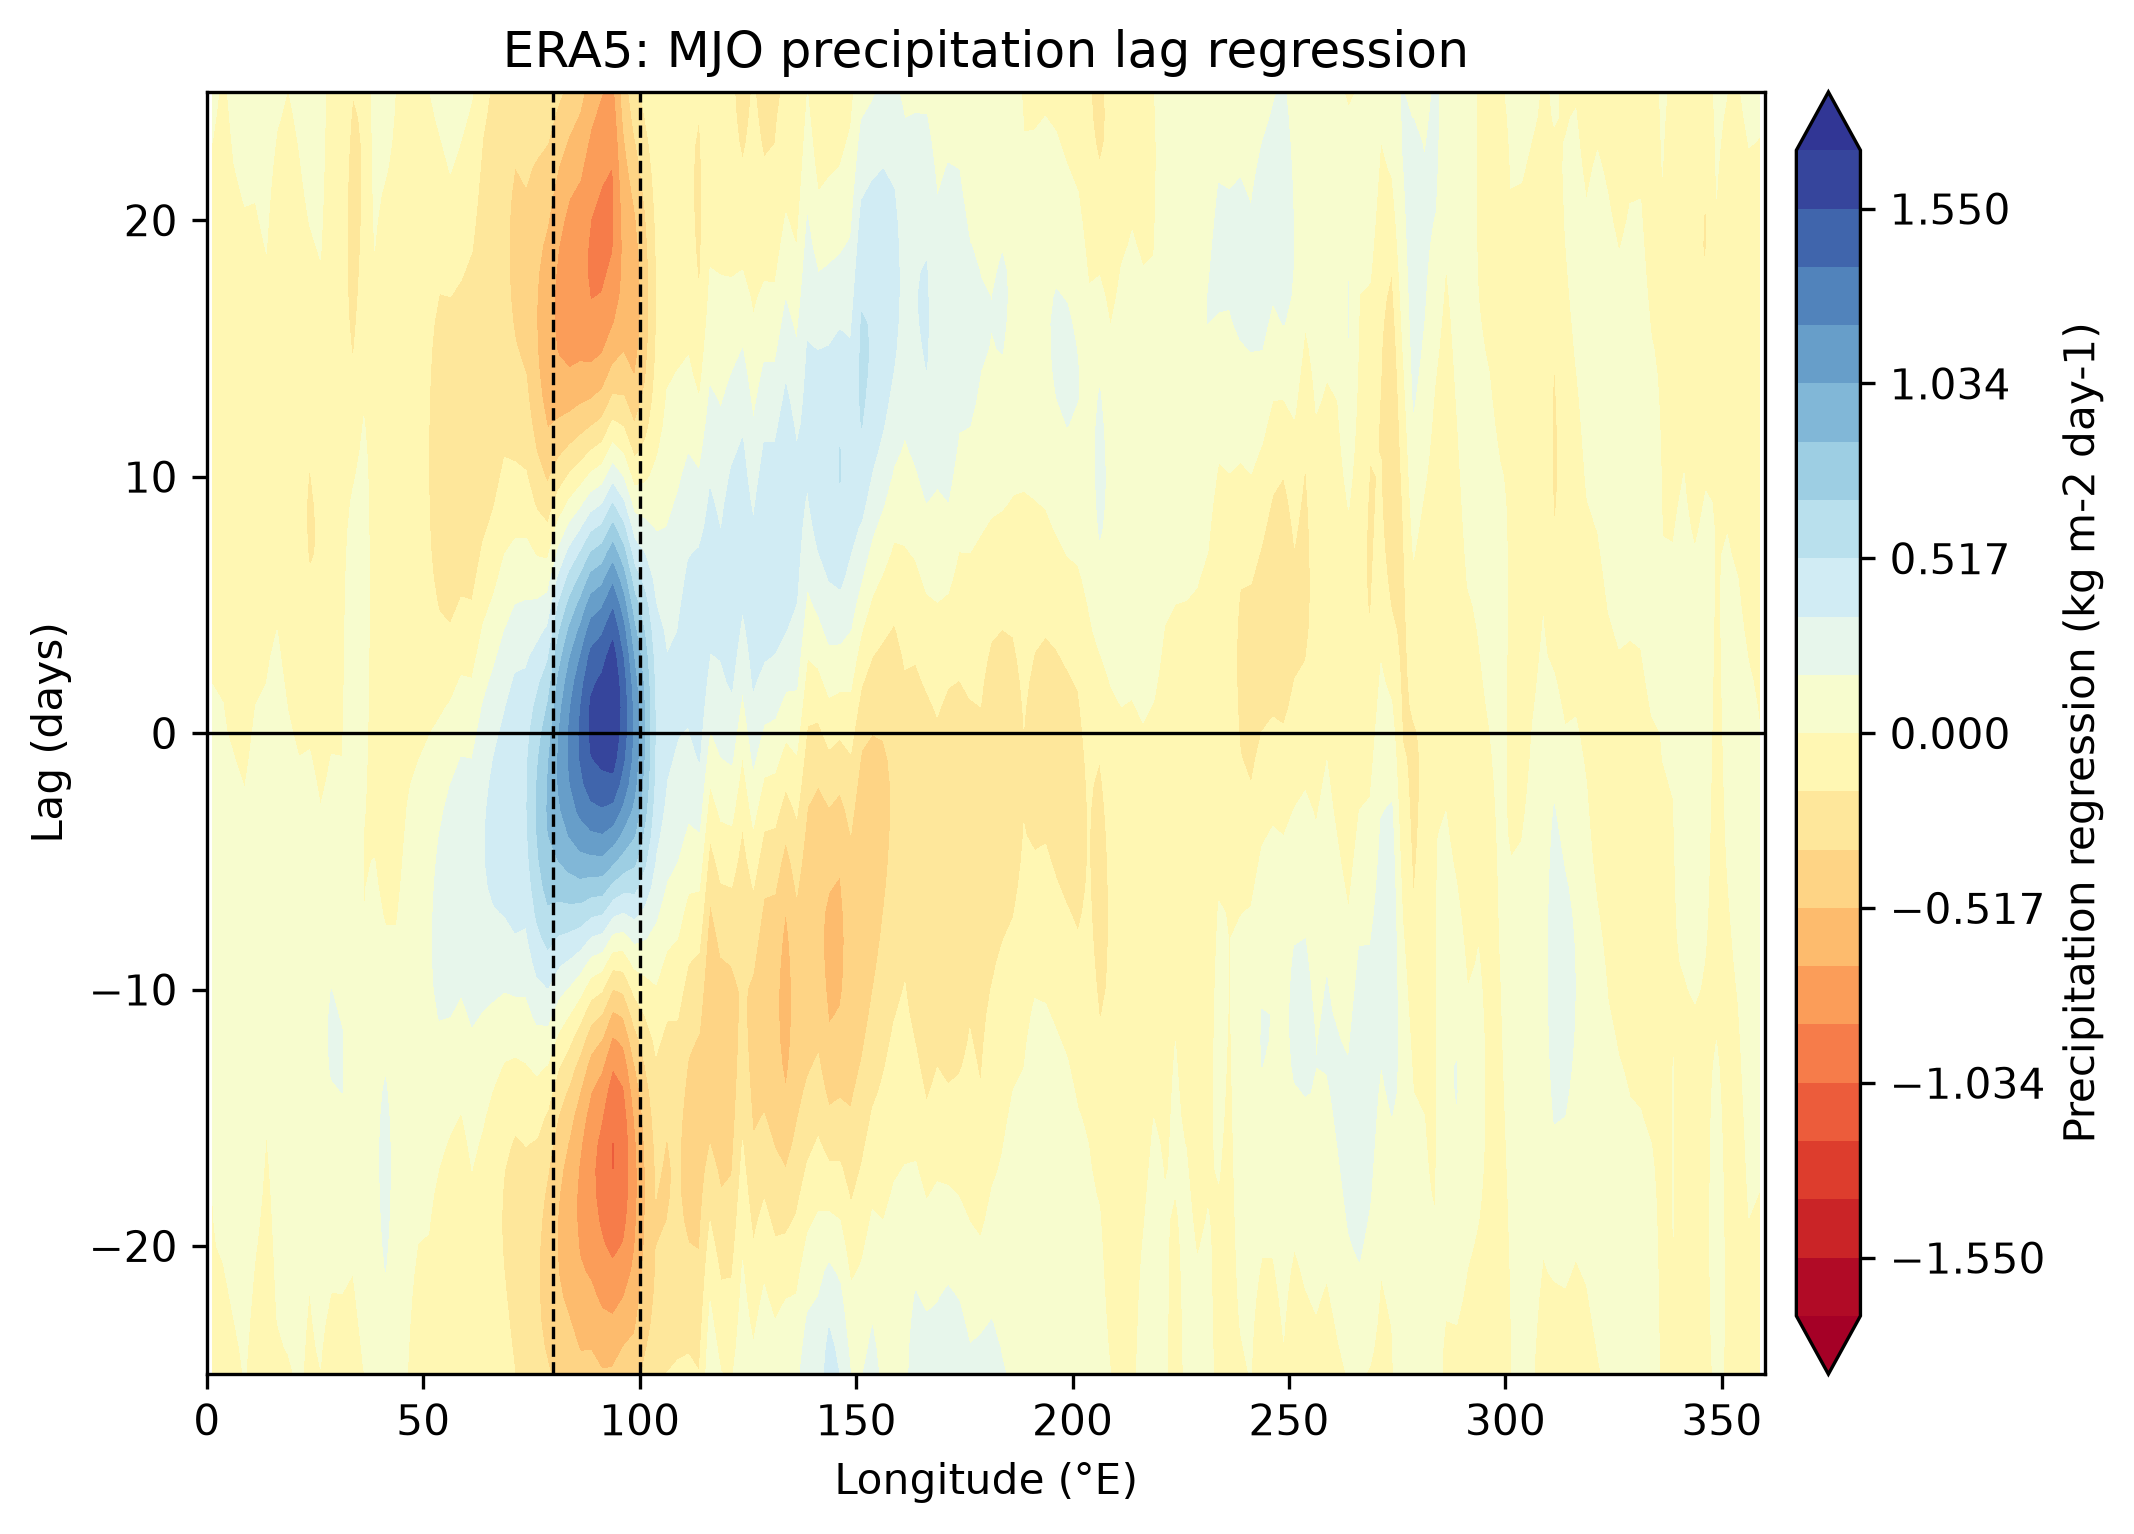
Fig. 187 Lag regression of 20-100 day filtered ERA5 precipitation against a precipitation index averaged over 80-100E, 1979-1983. Positive longitude-lag slope through the reference sector shows the eastward-propagating MJO precipitation signal.#